Financial Base
Support growth by strengthening profitability and improving capital efficiency
We achieve sustainable growth by increasing profits and improving capital efficiency backed by our financial strength, and deliver more returns to our shareholders.
Financial target / shareholder return policy
In order to maximize cash flow from our businesses, invest in ongoing growth and deliver steady returns to our shareholders, management needs to focus on capital efficiency. We set ROIC and ROE as management indicators in addition to net sales, operating margin and operating margin ratio in Vision 2022, our mid-term business plan drawn up in fiscal 2018 to strengthen profitability and improve capital efficiency.
Mid-Term Management Plan
| FY2022 Target | |
|---|---|
| Net Sales | ¥3,600 billion |
| Operating Income | ¥230 billion |
| Operating Margin Ratio | 6.40% |
| ROIC | 9% or more |
| ROE | 8% or more |
The Sumitomo Electric Group strives to achieve sustainable growth with profitability and improve capital efficiency based on a strong financial structure. The Company pays dividends to shareholders based on a comprehensive assessment of consolidated business performance, dividend payout ratio, level of internal reserves, and other factors, with the basic policy of maintaining stable dividends.
Capital-to-asset ratio
| FY2016 | FY2017 | FY2018 | FY2019 | FY2020 |
|---|---|---|---|---|
| 48.7% | 51.3% | 50.8% | 49.0% | 48.2% |
Dividend payout ratio
| FY2016 | FY2017 | FY2018 | FY2019 | FY2020 |
|---|---|---|---|---|
| 29.1% | 29.8% | 31.7% | 42.9% | 44.3% |
Business Results for FY2020
The business environment was harsh in FY2020, In the first half of the year in particular, due to a decrease in automobile production by the impact of COVID-19 and delays in telecommunications and electric power-related construction, as well as lower optical fiber prices. In this environment, consolidated net sales for the current fiscal year were 2,918.6 billion yen, a decrease year on year. In terms of profits, although the Company took extensive cost cutting measures such as reducing non-urgent expenses and curtailing capital investments, it was unable to fully absorb the impact of the decline in sales, and as a result, operating income, ordinary income, and net income attributable to shareholders of the parent company were 113.9 billion yen, 114.1 billion yen, and 56.3 billion yen lower than the previous year, respectively. For the second half of the fiscal year, net sales were 1,679.3 billion yen, each number shown above were 125.3, 138.1, and 98.2 billion yen, respectively. In addition to demand from the automotive sector staying at a high level due to the sharp recovery in automobile production, and the effects of company-wide cost reduction measures, sales and profits increased year on year, and both sales and profits reached record high for the second half of fiscal year.
Outlook for FY2021
In terms of FY2021, the business environment surrounding the Company is projected to remain unpredictable due to the spread of variants of the new coronavirus, uncertainty over the supply of semiconductors, surging material prices, and a shortage of shipping containers, etc. At the same time, we expect our business opportunities to continue to grow, as the automobile production recovers, CASE progresses, and the investment related to the date centers and the renewable energy increases. Given this situation, the Group will strive to increase the level of SEQCDD, which is the basis of the manufacturing industry, and will make company-wide efforts to achieve record-high sales and operating income in FY2021 by steadily capturing the increasing demand in the future.
Efforts to improve capital efficiency
Implementation of activities to improve ROIC
We are implementing activities to improve ROIC throughout the company as part of our initiatives to improve capital efficiency. Each division sets ROIC targets and uses an ROIC tree as a tool in its activities to improve ROIC. Activities are divided into three categories— expansion of sales (Category A), cost reduction (Category B) and improvement of asset efficiency (Category C)—and each division sets KPIs(Key Performance Indicators) for its businesses. Divisions report on initiatives they have taken to improve ROIC and KPIs they have set in their ROIC tree during management conferences. They then monitor the degree to which the KPIs have been accomplished and discuss solutions to issues at department meetings such as monthly results meetings. By using the ROIC tree to link ROIC with KPIs operated at the field level, we are able to widely disseminate the understanding of the effects and significance of our initiatives to employees and more effectively implement the PDCA cycle.
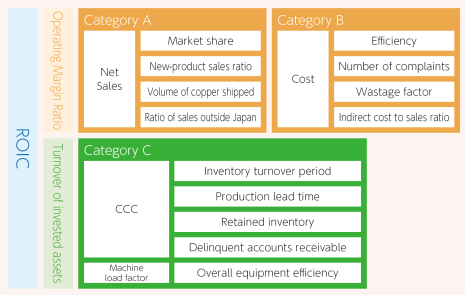
Example of ROIC tree at Sumitomo Electric
For example, in divisions requiring large investments in process industry equipment, indexes such as machine load factor (actual running time of facilities / baseline running time of facilities) and wastage factor are prioritized as KPIs in the ROIC tree. Results by product type are assessed and issues and solutions are discussed weekly. By focusing on machine load factor and wastage factor, which have the greatest impact on these divisions' results, these divisions have created a positive spiral where they are able to improve their plant turnover, which enables them to operate with less inventory. We have a variety of businesses, and as this method enables each business division to set the most appropriate KPIs and endeavor to accomplish the targets, we can carry out our businesses more effectively.
Initiatives to improve the efficiency of fund operations
To improve our capital efficiency, we have built a cash management system (CMS*), which facilitates effective use of capital within the group to keep outside interest-bearing debt down.
Our CMS was first introduced in our group companies in Japan before being expanded to the USA, Europe, China and other Asian countries as our businesses expanded. We allocate funding across countries or regions when capital is scarce or abundant in a particular country or region, enabling more efficient use of capital throughout the group.
*A system to facilitate efficient use of capital through integrated management of cash equivalents and debts in group companies and adjustment of surpluses and deficiencies that occur in group companies through capital loans and funding within the group.
Capital investment management
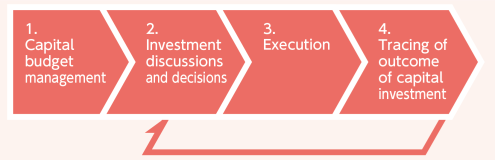
In order to make appropriate decisions on capital investment and to identify and share issues, we have implemented the following management cycle based on the PDCA cycle.
-
1.Capital budget management
Our divisions make capital investment plans according to their mid-term management plans. An overall capital investment plan for the whole company is set each year based on the figures given in our divisions' plans, taking into account our overall cash flow.
-
2.Discussions and decisions about capital investment
Individual capital investment are requested within the scope of our capital investment budget. As a general rule, they are only approved if they exceed the hurdle rates for ROI (return on investment) and IRR (internal rate of return) set for the applicable business and investment category.
-
3.Execution
If a capital investment is approved, it is executed according to the reported plan.
-
4.Tracing of outcome of plant investment
We measure the actual ROI on past capital investments and analyze the degree to which it deviates from the plan. This shows us whether the investment paid off. Factors behind a failure to meet the plan will be analyzed and reported, and the success factors and failures will be shared within the company so that they can be utilized in the consideration of future capital investments.