Financial Highlights
Performance Trends
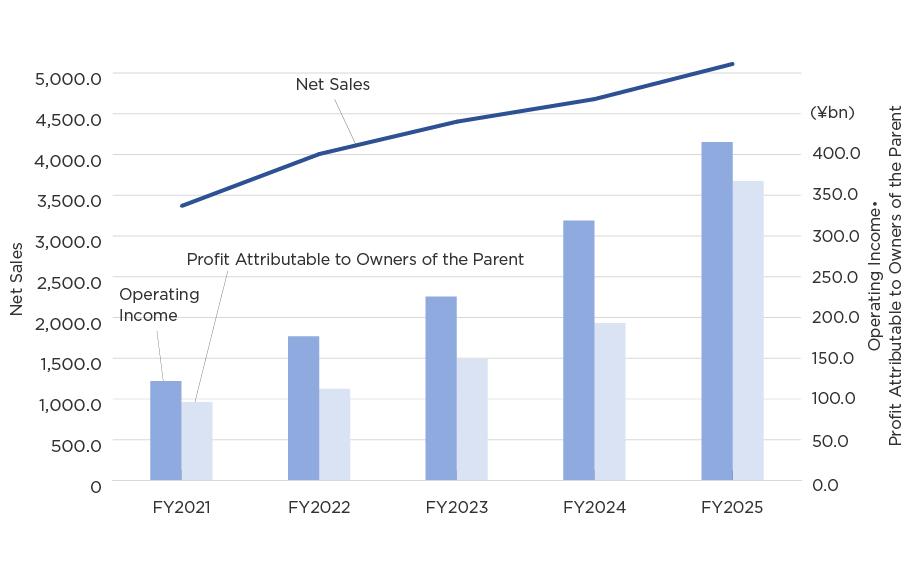
| (¥bn) | FY2021 | FY2022 | FY2023 | FY2024 | FY2025 |
|---|---|---|---|---|---|
| Net Sales | 3367.9 | 4,005.6 | 4,402.8 | 4,679.8 | 5,110.2 |
| Operating Income | 122.2 | 177.4 | 226.6 | 320.7 | 418.2 |
| Ordinary Income | 138.2 | 173.3 | 215.3 | 309.5 | 431.3 |
| Profit Attributable to Owners of the Parent | 96.3 | 112.7 | 149.7 | 193.8 | 369.5 |
| Total Assets | 3,807.4 | 4,013.0 | 4,365.4 | 4,441.6 | 4,824.5 |
| Total Net Assets | 2,052.9 | 2,110.8 | 2,431.9 | 2,530.4 | 2,835.0 |
| Interest-Bearing Debt | 859.8 | 960.4 | 801.5 | 775.9 | 709.8 |
| Cash Flows from Operating Activities | 76.0 | 265.2 | 393.5 | 402.3 | 425.2 |
| Cash Flows from Investigating Activities | (165.4) | (147.8) | (123.8) | (223.9) | (174.9) |
Financial Index
| FY2021 | FY2022 | FY2023 | FY2024 | FY2025 | |
|---|---|---|---|---|---|
Earnings per Share (¥/share) | 123.49 | 144.45 | 191.98 | 248.47 | 473.78 |
| Dividend per Share (¥/share) | 50.00 | 50.00 | 77.00 | 97.00 | 154.00 |
| Shareholders' Equity per Share (¥/share) | 2269.31 | 2436.14 | 2830.82 | 2936.93 | 3517.58 |
| ROIC* (%) | 4.5 | 5.9 | 7.2 | 9.8 | 12.2 |
| ROE (%) | 5.7 | 6.1 | 7.3 | 8.6 | 14.7 |
| Shareholders' Equity Ratio** (%) | 46.5 | 47.3 | 50.6 | 51.6 | 56.9 |
| ※ROIC = |
|
**Shareholders' equity = Net Assets excluding minority interests.
Capital Expenditure/ Depreciation and Amortization/ R&D Expenses
| (¥bn) | FY2021 | FY2022 | FY2023 | FY2024 | FY2025 |
|---|---|---|---|---|---|
Capital Expenditure (Investment in Fixed Assets) | 189.7 | 208.3 | 193.8 | 243.3 | 243.2 |
| Depreciation and Amortization | 180.5 | 196.0 | 206.3 | 206.2 | 209.8 |
| R&D Expenses | 123.1 | 127.7 | 142.0 | 156.3 | 162.9 |
Net Sales by Business Segment
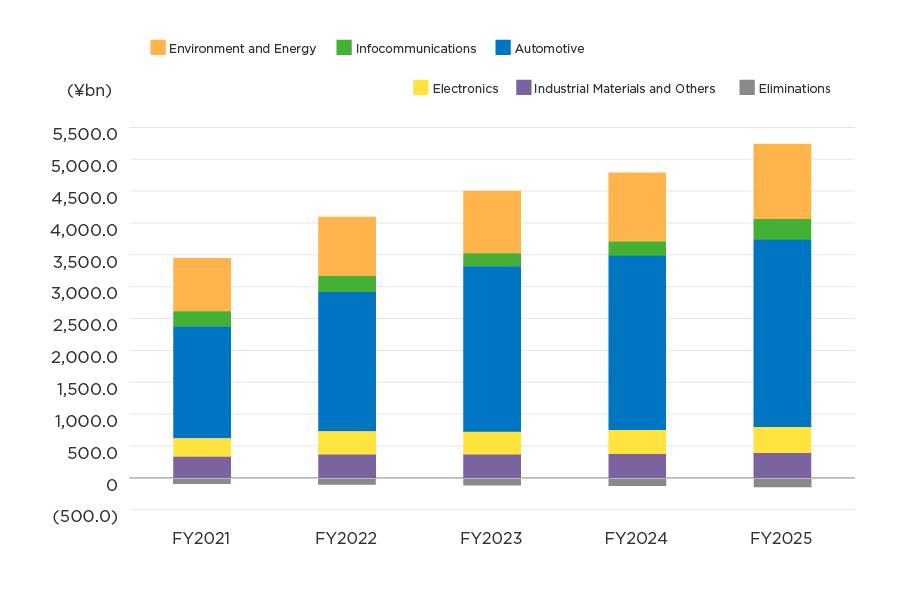
| (¥bn) | FY2021 | FY2022 | FY2023 | FY2024 | FY2025 |
|---|---|---|---|---|---|
Environment and Energy | 833.4 | 928.2 | 980.0 | 1,081.3 | 1,178.8 |
| Infocommunications | 239.2 | 250.3 | 206.1 | 223.3 | 326.6 |
| Automotive | 1,754.2 | 2,186.8 | 2,596.4 | 2,734.7 | 2,973.2 |
| Electronics | 292.5 | 366.0 | 356.5 | 377.2 | 409.1 |
| Industrial Materials and Others | 327.9 | 363.3 | 364.2 | 372.7 | 388.4 |
| Eliminations | (79.3) | (89.0) | (100.3) | (109.5) | (129.9) |
| Consolidated Total | 3,367.9 | 4,005.6 | 4,402.8 | 4,679.8 | 5,110.2 |
Net Sales by Area
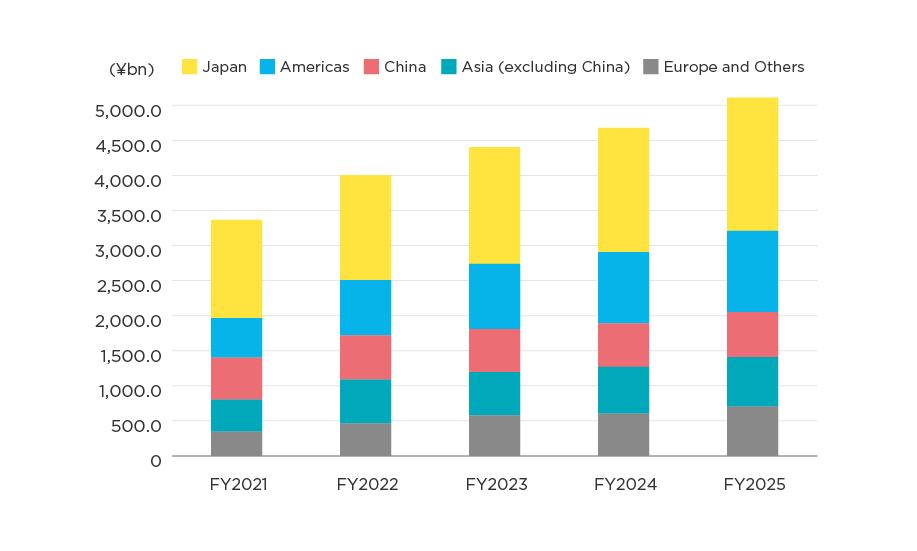
| (¥bn) | FY2021 | FY2022 | FY2023 | FY2024 | FY2025 |
|---|---|---|---|---|---|
| Japan | 1,403.3 | 1,497.3 | 1,664.8 | 1,775.2 | 1,901.2 |
| Americas | 562.2 | 788.9 | 928.3 | 1,015.4 | 1,159.4 |
| China | 598.3 | 630.3 | 615.1 | 617.9 | 640.7 |
| Asia (excluding China) | 456.0 | 626.0 | 615.8 | 666.7 | 705.4 |
| Europe and Others | 348.0 | 463.1 | 578.7 | 604.6 | 703.4 |
| Total | 3,367.9 | 4,005.6 | 4,402.8 | 4,679.8 | 5,110.2 |